Labeling Cracks and Regions of
Interest with GIMP
September 28, 2020
by Yunsong Huang
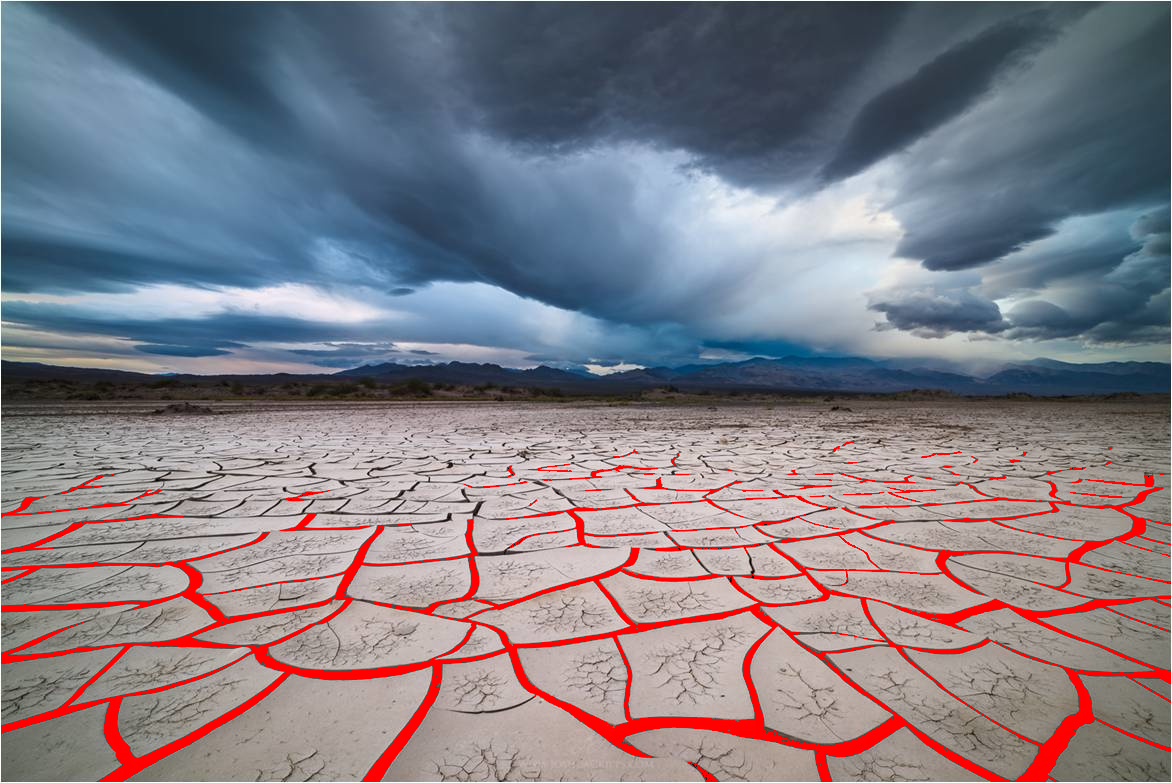
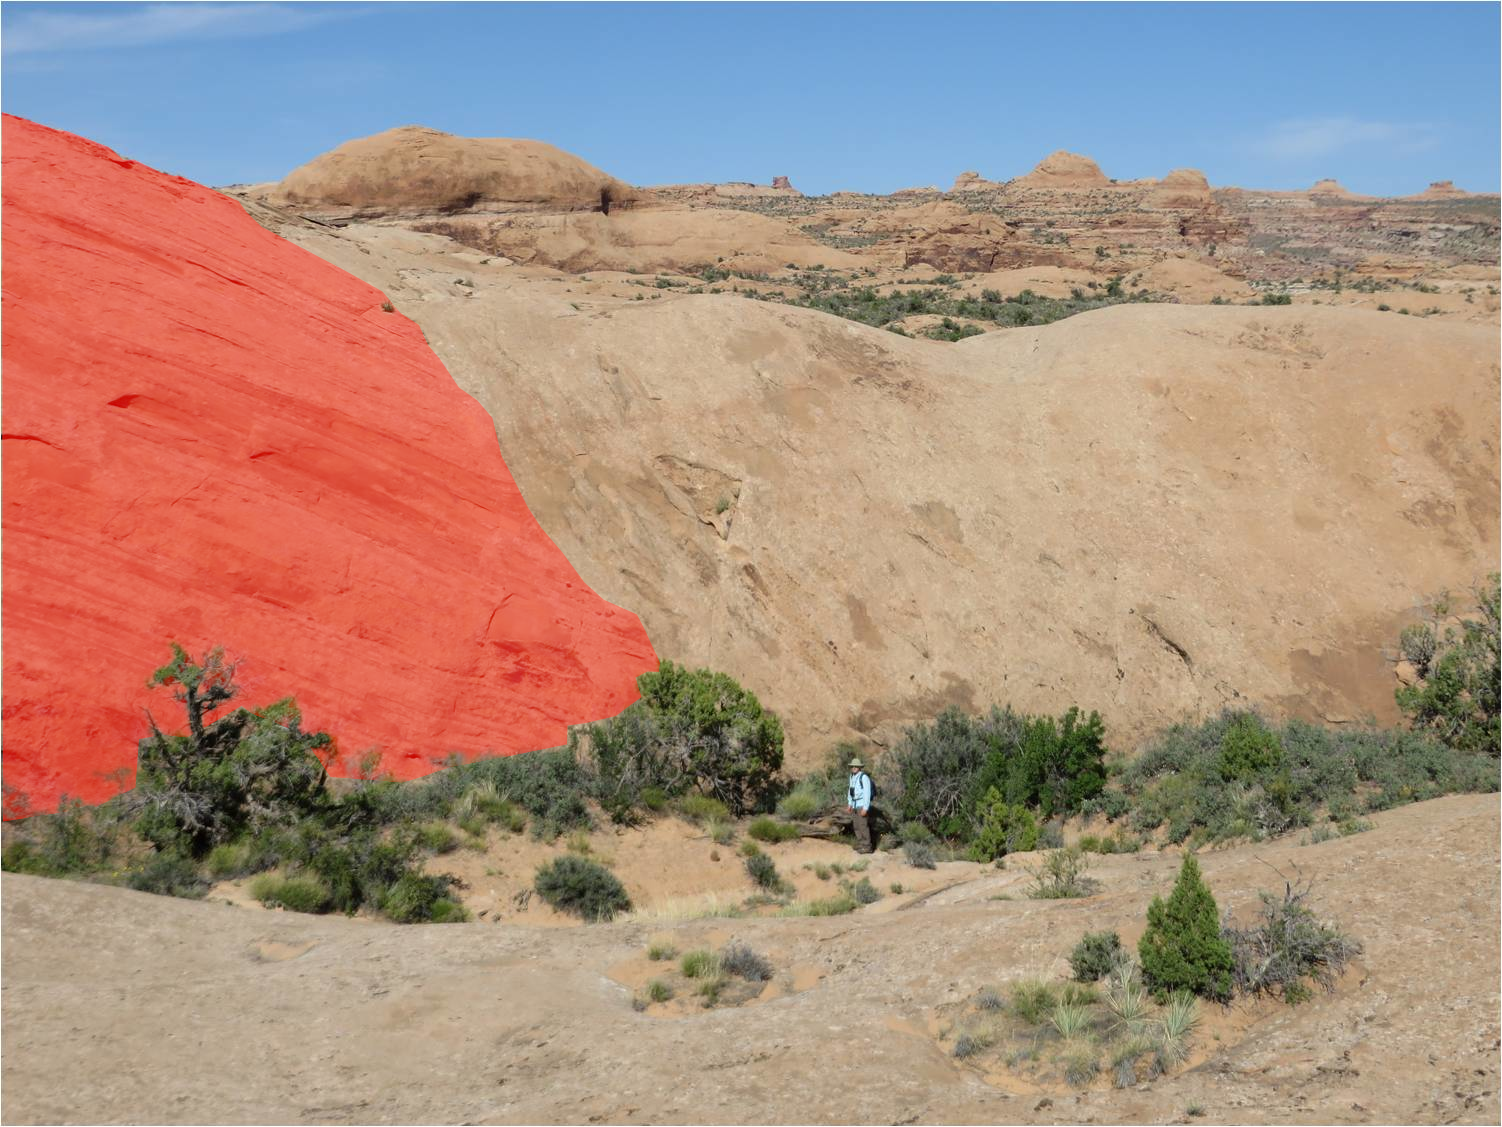
Figure 1: Superimposed on the original images are labeled cracks
in red (left) and labeled region in pink (right).
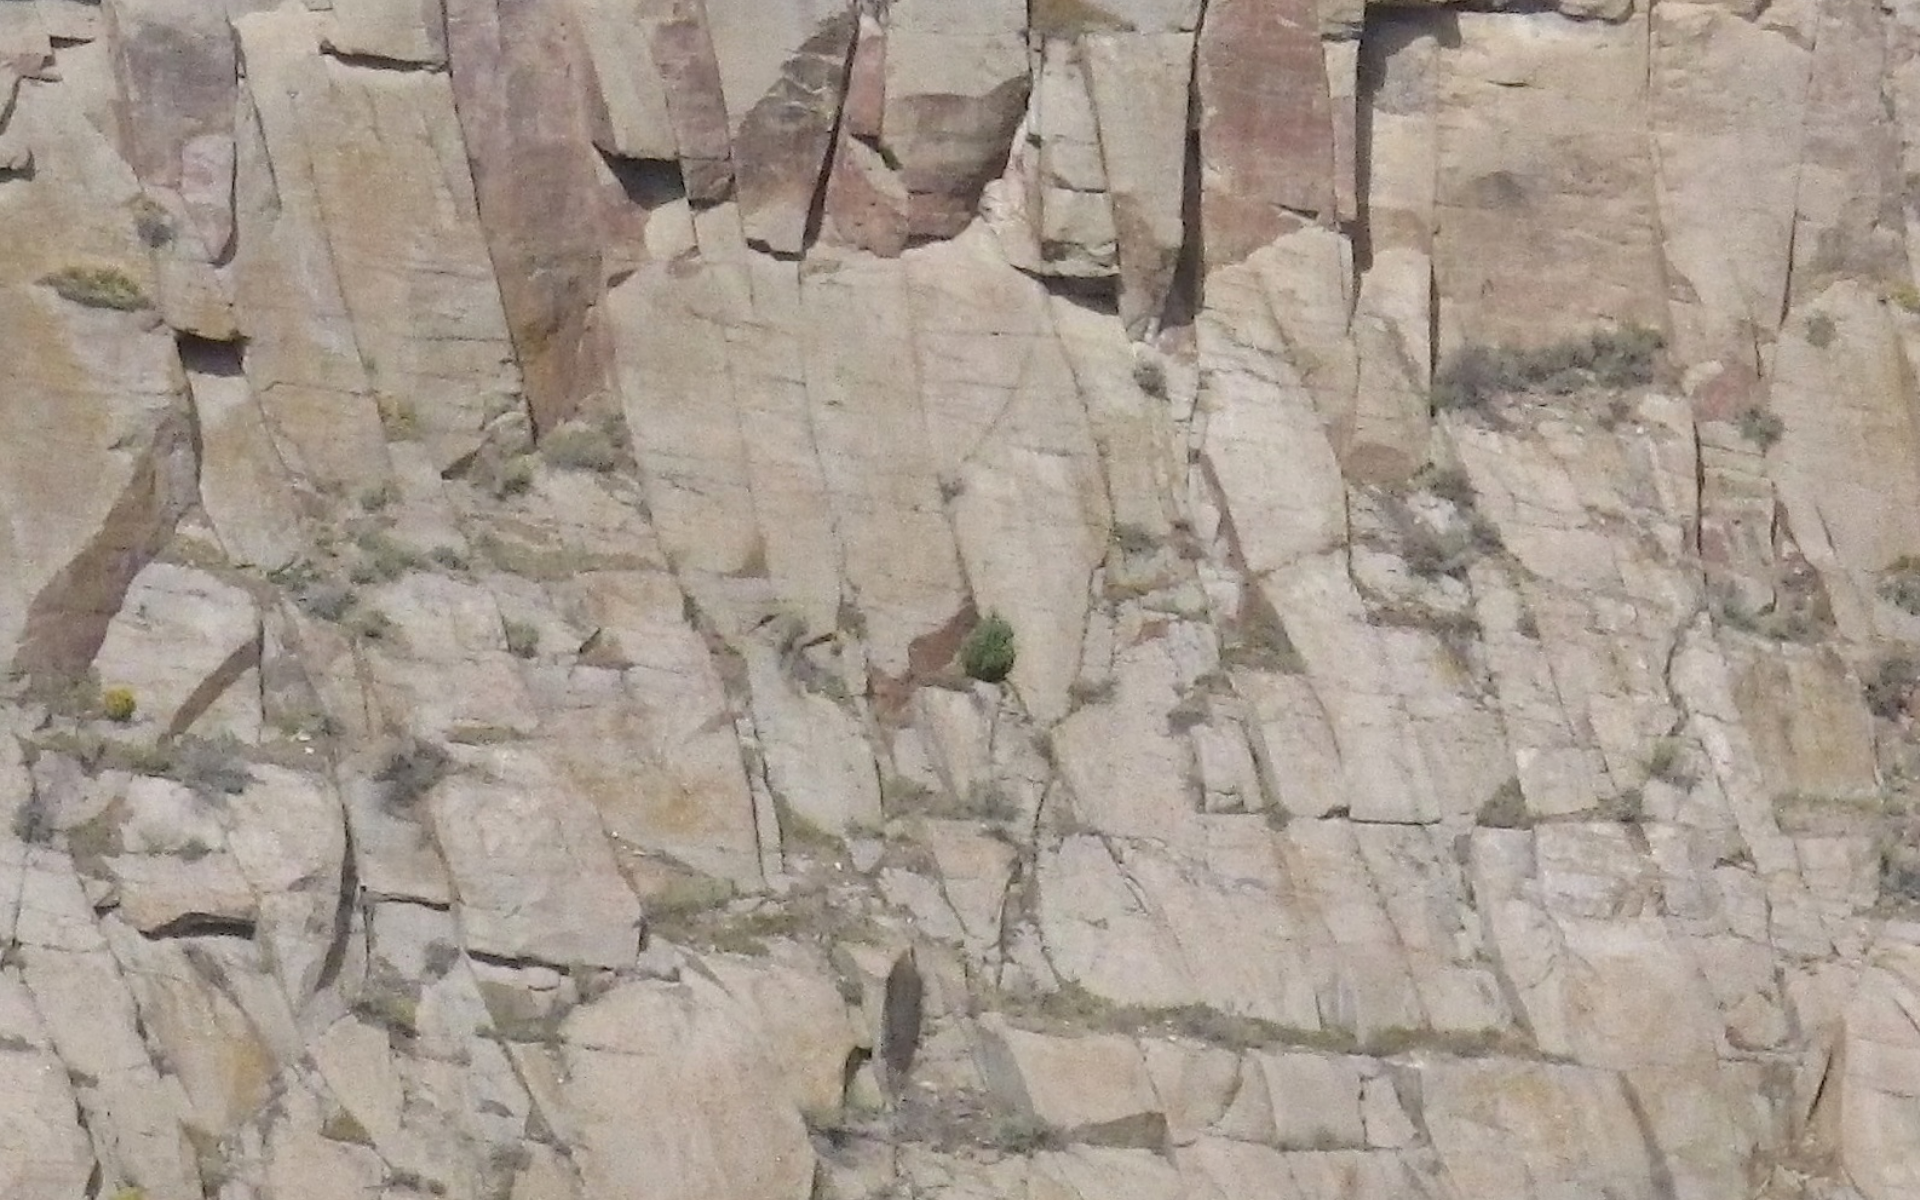
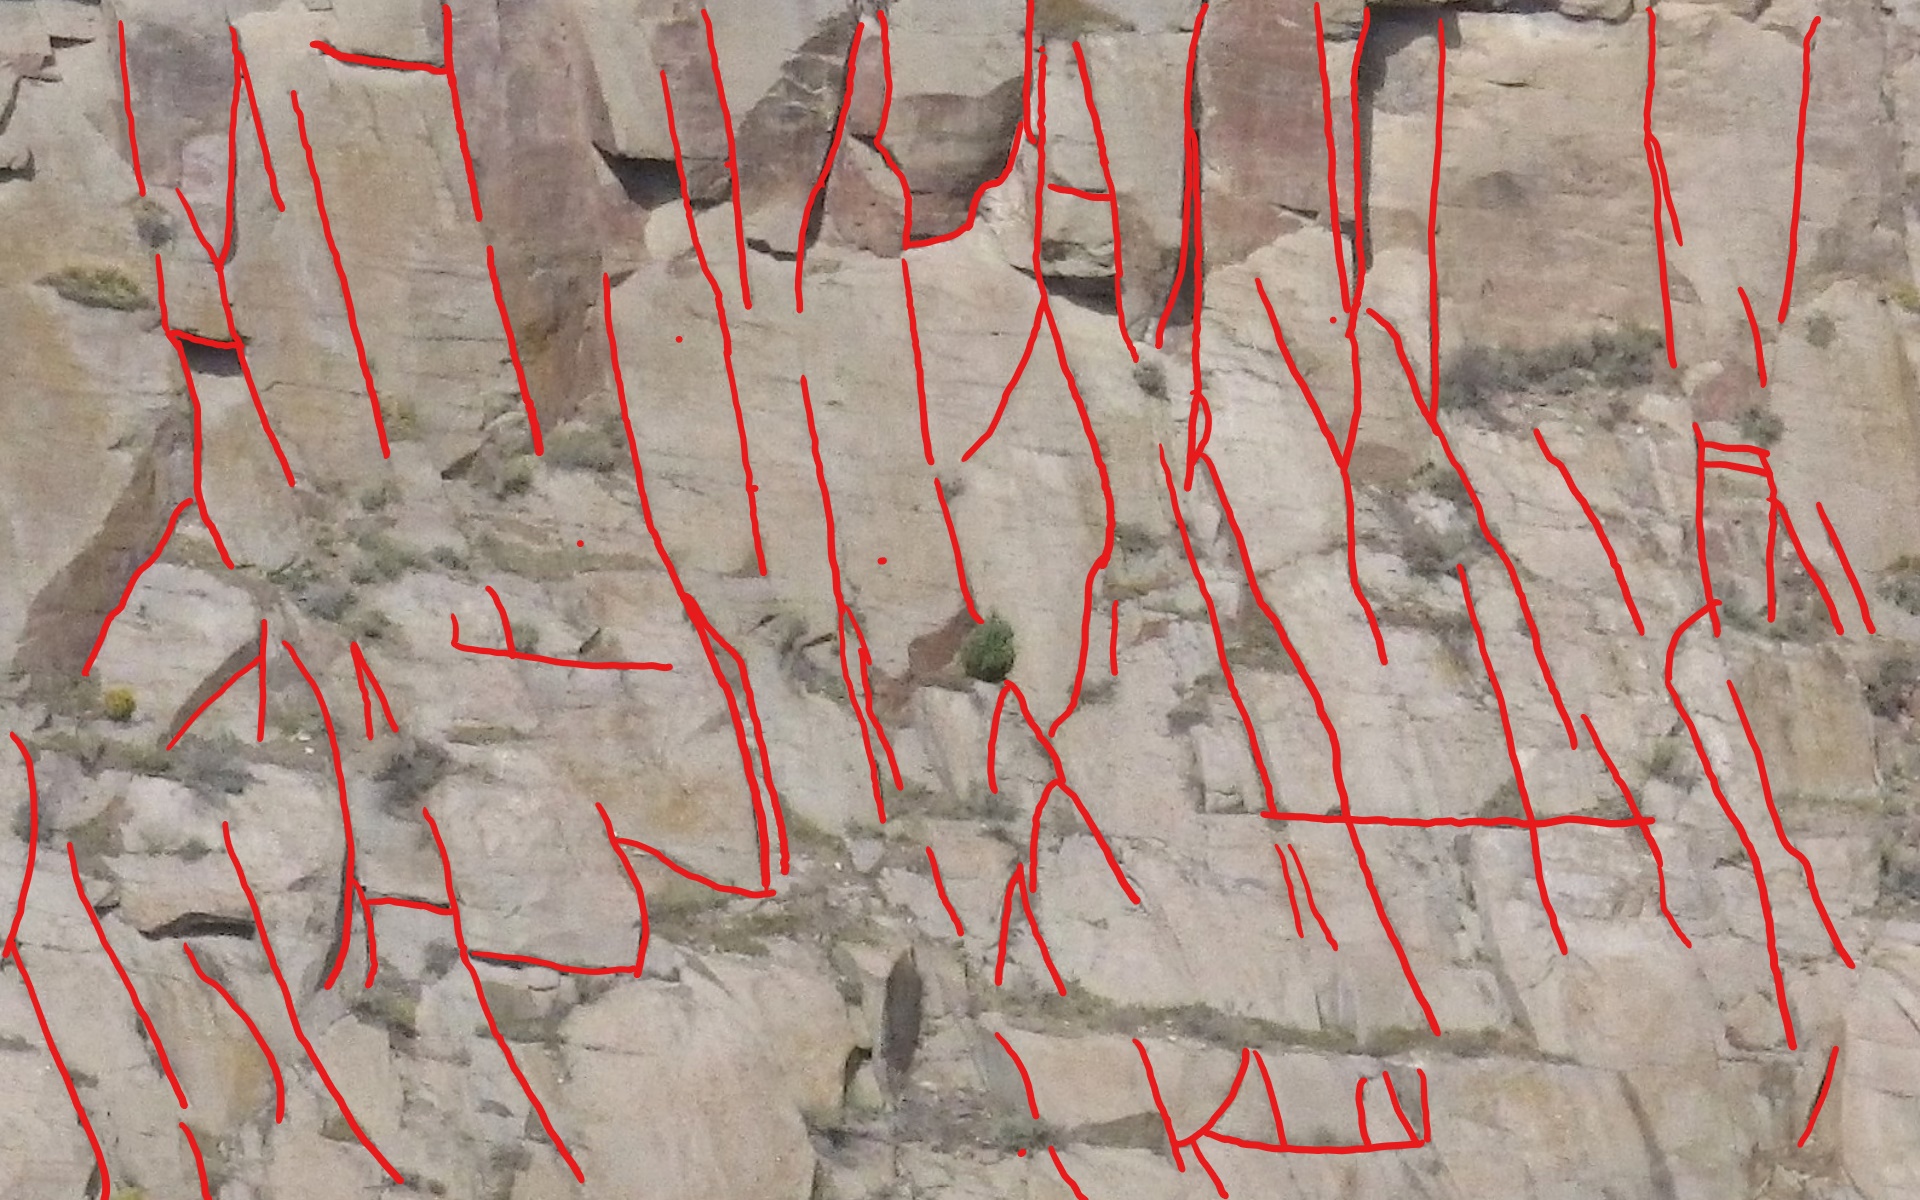
Figure 2: (left) Solidified lava flow, and the cracks are labeled
(right).
1. Objective Using GIMP, label
either cracks or regions of interest in images. Using a Matlab function
to de-mean and normalize the images.
2. Prerequisite
3. Procedure
- Download GIMP_lab_files.zip
and unzip it.
- In this
unzipped directory,
- Cracks_region_labelling_w_GIMP.pptx
PPT for Instructions
- Mudcracks3.jpg
Image of mud cracks, corresponding to Figure 1 (left)
- nrm_def_mass2.jpg
Image of a rock wall, corresponding
to Figure 1 (right)
- volcanic2zoomin.png
Figure 2
(left)
- images(0).png
- ...
- images(4).png
Five images of
solidified lava flow, similar to
Figure 2 (left)
- DeMean_Normalize.m
MATLAB function for de-meaning and normalizing images
- Download the PPT. Attend my
lecture on labeling with GIMP. In addition, by following
the instructions in the PPT, label the images provided in the unzipped
directory.
- Change
your Matlab working directory to the unzipped directory. At Matab
command prompt, run DeMean_Normalize,
which is going to de-mean and normalize all original images in the
current directory, while excluding any image files with name
*label*. The results have filenames such as
0M1V_Mudcracks3_783x1172x3.float32, where "0M1V"
stands for 0-mean and unit variance; "Mudcracks3" is the original
image file's main name,and this image is of size 783x1172
in color (therefore the x3,
i.e., 3 color channels. This option is absent if the image is in
grey-scale). Here, 783 is the
fastest dimension, and the color channels are the slowest
dimension. Finally, this
resulting file is binary, where each value is represented in float32.
The reason why the resulting files are in raw binary is, if they were
image files, then automatic shift, re-scaling, and discretization
would be carried out by the image codec, thereby defeating the purpose
of de-meaning
and normalization here. The subsequent CNN will take such
raw binary files as input.
4.
PS
If
there are any errors in this Lab, please contact:
yunsongh[at-sign]gmail.com