Clustering of High-dimensional Geochem Data
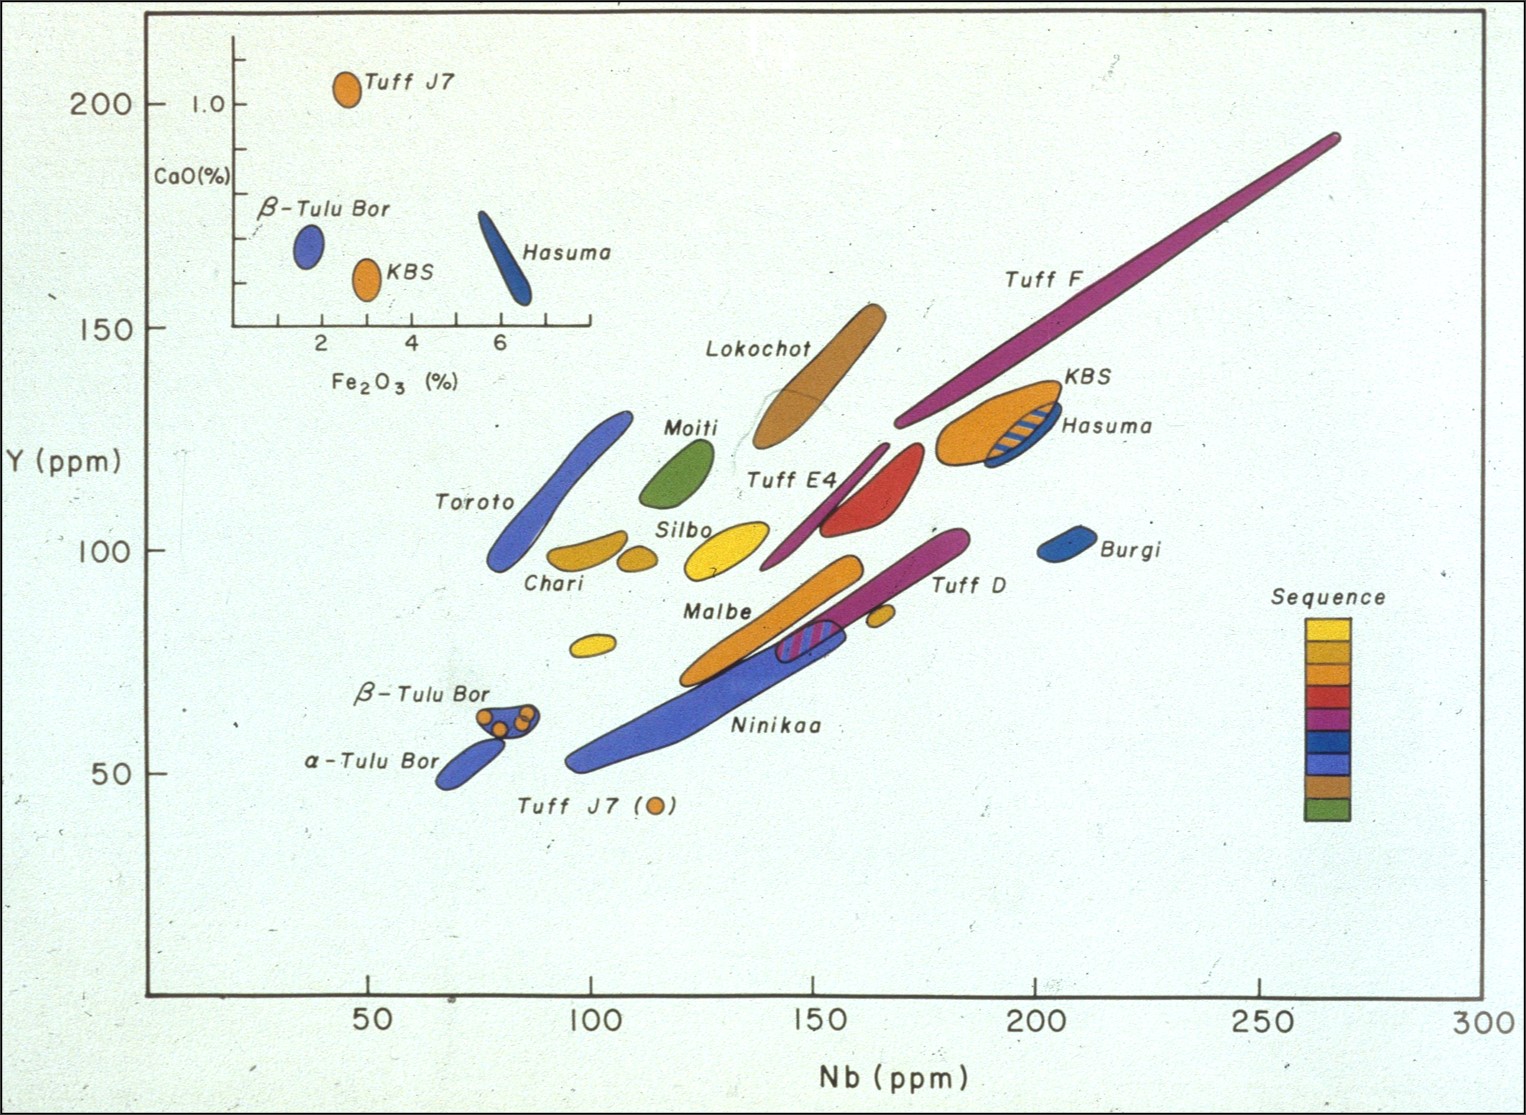
Figure 1. Turkana Tuff samples from different formations
plotted as percent content of Nb vs Y.
Objective: Use DBSCAN, Self Organizing Maps and Silohouette analysis to cluster the chemical content of Geochem Turkana samples provided by Patrick Gathogo. Each sample provides the percent content of more than 20 elements, and the goal is to see if a clustering method can be used to characterize a unique formation with a unique cluster. In this way, analyzing the geochemical signature of a material from the Turkana region will pinpoint which formation it came from.
Procedure for Project I:
- Download the Tuff spreadsheet of Geochemical data.
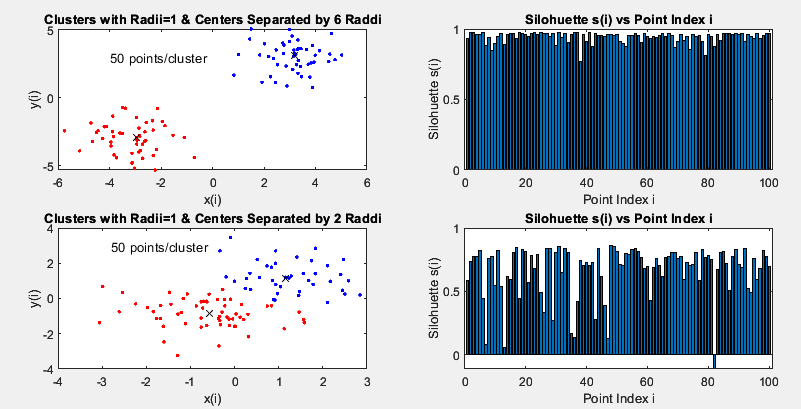
- Go to the Silohuette lab. Download the MATLAB code. Use the DBSCAN and elbow analysis to cluster the data. Use the Silohuette graph, similar to this figure, for analyzing the clustered results. The DBSCAN CoLab is here.
- Same as above except use the SOM analysis to assess the best clustering strategy.
- Perhaps try other clustering strategies such as Information weighted clustering (Jan 16 lecture). This might make sense because the SOM and DBSCAN results might suggest downweighting certain elements because they don't help distinguish one formation from another.
- Here is a Colab for applying DBCAN to sdownloading "Stone_cluster" data. This colab has a picture of the Turkana Tuff data.
Procedure for Project II:
- Same as Project I (above) except use a FCNN or CNN (perhaps Alexnet) classifier, where the output softmax has over twenty classes. Is there enough data for accurate training? How can one augment the data?
Report:
- PPT presentation should have the following slides: Title, Outline, Problem Definition and Proposed Solution, Procedure slides, Results slides, Conclusion, Future Work. Grab the EAGE London ppt at as an example.
- Write up should be a paper (e.g. 4-page extended abstract) that contains the following elements: Abstract, Intoduction, Procedures, Results, Conclusions. Perhaps 4-6 written pages, with as many figures as you need.