Silohuette Analysis of Clustering Results
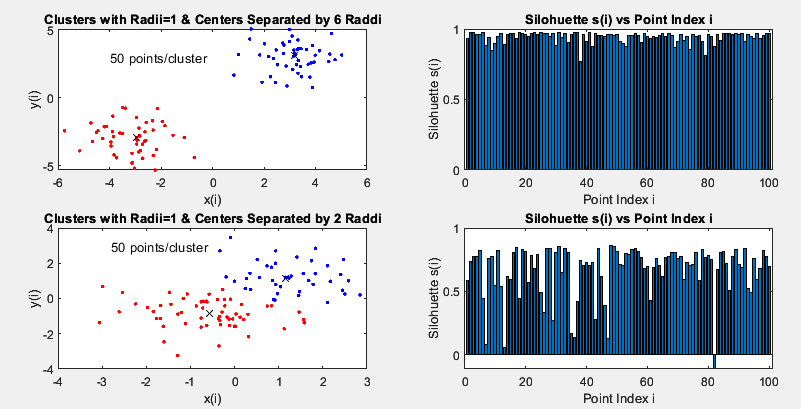
Figure 1. Different clusters of points (50 pts/cluster) and
their corresponding silohuettes s(i) on the right. The points with indices from 1 to
50 belong to the red cluster, and points with i between 51 and 100 belong to the blue cluster.
Points where s(i)>0.8 are typically considered well clustered in that
they are very "close" to many other points in that cluster and far from points in other clusters.
For example, the ith red points on the left side graph that are near the centroid (black x)
should have s(i)>0.8.
Objective: In this lab, we use the silohuette function s(i) to analyze the quality of the cluster point x(i).
Procedure:
- Download the MATLAB code K-means and Silohuette. Type "Silohuette" in MATLAB and view the clustering and silohouette graphs similar to Figure 1.
- Setting the number of clusters as "2" in the MATLAB command "kmeans(X, 2, 'Distance','city', 'Replicates',5, 'Options',opts);" determines the number of clusters and "X" is the input of points to be clustered. In this example each input point is a 2D vector.
-
The number of points in a cluster is determined by setting "npts".
The code generates two clusters with
X = [randn(npts,2)+mf*ones(npts,2); randn(npts,2)-mf*ones(npts,2)]
- Kmeans is used to classify the points into, for example, two clusters:
[cidx, ctrs] = kmeans(X, 2, 'Distance','city', 'Replicates',5, 'Options',opts)
The cluster index of each point is given in "cidx" and the coordinates of each centroid is in "cidx".
- The silohuette s(i) values are generated+plotted for each point x(i) by the commands
" s = silhouette(X, cidx, 'sqeuclid'); bar(s)". Here, the cluster centers in "ctrs"
of raddi =1
are separated the distance "mf" in the random point generator
given by
npts=50;mf=3; X = [randn(npts,2)+mf*ones(npts,2); randn(npts,2)-mf*ones(npts,2)]; opts = statset('Display','final');
- If you have some data from your research or your interests, try computing the silohuette function for your clustered data. Does it provide a useful indicator that the points are well clustered? Explain how you would find the optimal number of clusters by using Silohuette curves for different numbers of clusters. Could the "fatness" of silohuette curves be quantified so that a "fatness" coefficient be plotted against different number of clusters? Is this similar to plotting elbow curves?
- Generate three clusters of points and their Silohuette plots. In one example, make sure the clusters are well separated so their Silohuette values are near the value "1". Then, bring the clusters closer together so their Silohuette values range over a large range between -1 and 1. Are the Silohuette curves a good measure of the quality of the clustering?
- Repeat the above exercise except generate three clusters of 3D points so that each has the coordinates (x(i), y(i), z(i)).