Faster R-CNN Algorithm for the Full Blood Cell Detection
Zhaolun Liu
Nov 12, 2019
Nov 12, 2019

Objective
- Learn about setting up faster R-CNN training with Keras
- Use faster R-CNN network to do object detection of input images
Prerequestion
Before we actually get into the model building phase, we need to ensure that the right libraries and frameworks have been installed. The below libraries are required to run this project:
- tensorflow 1.11.0
- keras 2.2.4
- pandas
- matplotlib
- numpy
- opencv-python
- sklearn
- h5py
Procedure
- Download the code and unzip it.
- The whole Dataset is in folder "cell_data/BCCD" and the test dataset is in "test_image".
- The Main faster RCNN codes for training and testing are "train_frcnn.py" and "test_frcnn.py", respectively. There are some other subroutines in folder "keras_frcnn".
Exercises
- Run Code: Run the code U_Net.ipynb to get the results from simple training.
- Change to a larger training Data Size: Load the pretrained model using 145 images and test it with "!python test_frcnn.py -p test_image --model_path=model_frcnn_145pics_22epoch.hdf5", compare the predicted result.
- Change to a different step length method. Comment on effectiveness of your choice.
- Possible Project: Replace pictures of labeled blood samples with labeled pictures of rock thin sections that contain fossils. Use labeled pictures to train the R-CNN, and then use the trained network to window and label fossil thin sections. If actual labeled data is not available, download thin-section pictures of fossils from the WWW, snip out the relevant identified fossils, and create a large synthetic set of fossil tin sections.
Data Exploration
Let's firstly look at the dataset in "cell_data/BCCD". You can download it from [github] (https://github.com/Shenggan/BCCD_Dataset).
You can see a example of the labeled cell image.
We have three kind of labels :
- RBC (Red Blood Cell)
- WBC (White Blood Cell)
- Platelets
The structure of the cell_data is:
  ├── BCCD
  │   ├── Annotations
  │   │       └── BloodImage_00XYZ.xml (364 items)
  │   ├── ImageSets       # Contain four Main/*.txt which split the dataset
  │   └── JPEGImages
  │       └── BloodImage_00XYZ.jpg (364 items)
  ├── example.jpg         # A example labeled img generated by visualize.py
The
JPEGImages:- Image Type : jpeg(JPEG)
- Width x Height : 640 x 480
The
Annotations: The VOC format.xmlfor Object Detection, automatically generate by the label tools. Below is an example of.xmlfile, which includes the bounding boxes.<annotation> <folder>JPEGImages</folder> <filename>BloodImage_00000.jpg</filename> <path>/home/pi/detection_dataset/JPEGImages/BloodImage_00000.jpg</path> <source> <database>Unknown</database> </source> <size> <width>640</width> <height>480</height> <depth>3</depth> </size> <segmented>0</segmented> <object> <name>WBC</name> <pose>Unspecified</pose> <truncated>0</truncated> <difficult>0</difficult> <bndbox> <xmin>260</xmin> <ymin>177</ymin> <xmax>491</xmax> <ymax>376</ymax> </bndbox> </object> ... <object> ... </object> </annotation>
Here we modified the data in the following aspects:
- The bounding boxes have been converted from the given .xml format to a .csv format
- The whole dataset is splited into the training and test sets by randomly picking images
Firstly, we will randomly select the training images from the dataset and convert the .xml file to .csv file.
import xml.etree.ElementTree as ET
import csv
from random import seed
import os.path
from random import randint
import random
# seed random number generator
seed(1)

# open a file for writing

csv_data = open('./cell_data/train.csv', 'w')
# create the csv writer object
csvwriter = csv.writer(csv_data)
csv_head = ['Image_names','cell_type','xmin','xmax','ymin','ymax']
csvwriter.writerow(csv_head)
# generate 10 integers randomly between 0 and 410
count = 0
namelist = []
lis=range(0, 410);
alldatalist = random.sample(lis,20)
for i in range(20):
    value = alldatalist[i]
    imagename = "./cell_data/BCCD/Annotations/BloodImage_%05d.xml" % (value)
    if os.path.isfile(imagename):
        count = count + 1
        namelist.append(value)
        tree=ET.parse(imagename)
        root=tree.getroot()
        filename=root.find('filename').text
        print(filename)
        for region in root.findall('object'):
            csv = []
            csv.append(filename)
            name = region.find('name').text
            csv.append(name)
            xmin = region.find('bndbox').find('xmin').text
            csv.append(xmin)
            xmax = region.find('bndbox').find('xmax').text
            csv.append(xmax)
            ymin = region.find('bndbox').find('ymin').text
            csv.append(ymin)
            ymax = region.find('bndbox').find('ymax').text
            csv.append(ymax)
            #print('cell_type='+name,'xmin='+xmin,'xmax='+xmax,'ymin='+ymin,'ymax='+ymax)
            csvwriter.writerow(csv)
csv_data.close()
print('The above %d images have been selected.' % (count))
The reminding pictures can be used to test our results. So, we will select 10 images from the remaining images for testing.
from shutil import copyfile
test_num = 10
count = 1
for value in range(0,410):
    if value not in namelist:
        #print(value)
        imagename = "./cell_data/BCCD/JPEGImages/BloodImage_%05d.jpg" % (value)

        if os.path.isfile(imagename):
            dist = "test_image/BloodImage_%05d.jpg" % (value)
            copyfile(imagename,dist)
            count += 1
            if count == test_num:
                break
Let’s read the .csv file and print out the first few rows.
# importing required libraries
import pandas as pd
import matplotlib.pyplot as plt
%matplotlib inline
from matplotlib import patches
# read the csv file using read_csv function of pandas
train = pd.read_csv('./cell_data/train.csv')
train.head()
There are 6 columns in the train file. Let’s understand what each column represents:
- Image_names: contains the name of the image
- cell_type: denotes the type of the cell
- xmin: x-coordinate of the bottom left part of the image
- xmax: x-coordinate of the top right part of the image
- ymin: y-coordinate of the bottom left part of the image
- ymax: y-coordinate of the top right part of the image
Let’s now print an image to visualize what we’re working with:
# reading single image using imread function of matplotlib
fileno = 55
newimage='./cell_data/BCCD/JPEGImages/BloodImage_%05d.jpg' % (fileno)
image = plt.imread(newimage)
plt.imshow(image)

This is what a blood cell image looks like. Here, the blue part represents the WBCs, and the slightly red parts represent the RBCs. Let’s look at how many images, and the different type of classes, there are in our training set.
# Number of unique training images
train['Image_names'].nunique()
So, we have 10 training images.
# Number of classes
train['cell_type'].value_counts()
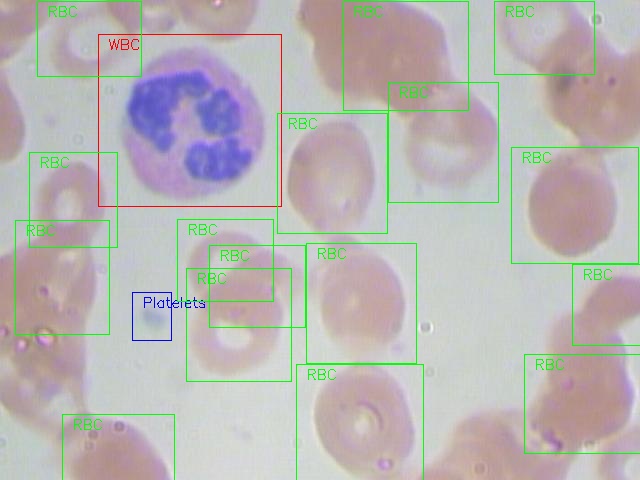
We have three different classes of cells, i.e., RBC, WBC and Platelets. Finally, let’s look at how an image with detected objects will look like:
fig = plt.figure()

#add axes to the image
ax = fig.add_axes([0,0,1,1])

# read and plot the image
image = plt.imread(newimage)
plt.imshow(image)

# iterating over the image for different objects
for _,row in train[train.Image_names == "BloodImage_%05d.jpg" % (fileno)].iterrows():
    xmin = row.xmin
    xmax = row.xmax
    ymin = row.ymin
    ymax = row.ymax

    width = xmax - xmin
    height = ymax - ymin

    # assign different color to different classes of objects
    if row.cell_type == 'RBC':
        edgecolor = 'r'
        ax.annotate('RBC', xy=(xmax-40,ymin+20))
    elif row.cell_type == 'WBC':
        edgecolor = 'b'
        ax.annotate('WBC', xy=(xmax-40,ymin+20))
    elif row.cell_type == 'Platelets':
        edgecolor = 'g'
        ax.annotate('Platelets', xy=(xmax-40,ymin+20))

    # add bounding boxes to the image
    rect = patches.Rectangle((xmin,ymin), width, height, edgecolor = edgecolor, facecolor = 'none')

    ax.add_patch(rect)

We will be using the keras_frcnn library to train our model as well as to get predictions on the test images.
Finally, we will convert .csv file to the file annotate.txt that our code can use. The annoate.txt should have the following format:
filepath,x1,y1,x2,y2,class_namewhere
- filepath is the path of the training image
- x1 is the xmin coordinate for bounding box
- y1 is the ymin coordinate for bounding box
- x2 is the xmax coordinate for bounding box
- y2 is the ymax coordinate for bounding box
- class_name is the name of the class in that bounding box
data = pd.DataFrame()
data['format'] = train['Image_names']

# as the images are in train_images folder, add train_images before the image name
for i in range(data.shape[0]):
    data['format'][i] = 'cell_data/BCCD/JPEGImages/' + data['format'][i]

# add xmin, ymin, xmax, ymax and class as per the format required
for i in range(data.shape[0]):
    data['format'][i] = data['format'][i] + ',' + str(train['xmin'][i]) + ',' + str(train['ymin'][i]) + ',' + str(train['xmax'][i]) + ',' + str(train['ymax'][i]) + ',' + train['cell_type'][i]

data.to_csv('./annotate.txt', header=None, index=None, sep=' ')
Implementing Faster R-CNN
Let's train our model! We will be using the train_frcnn.py file to train the model.
!python train_frcnn.py -o simple -p annotate.txt --num_epochs=100
Let’s make the predictions for the new images:
!python test_frcnn.py -p test_image
# reading results
fileno = 0
f = plt.figure(figsize=(15,15))
for fileno in range(4):
    plt.subplot(2,2,fileno+1)
    newimage='./results_imgs/%d.png' % (fileno)
    image = plt.imread(newimage)
    plt.imshow(image)
plt.show()

The lab above adapter from https://www.analyticsvidhya.com/blog/2018/11/implementation-faster-r-cnn-python-object-detection/